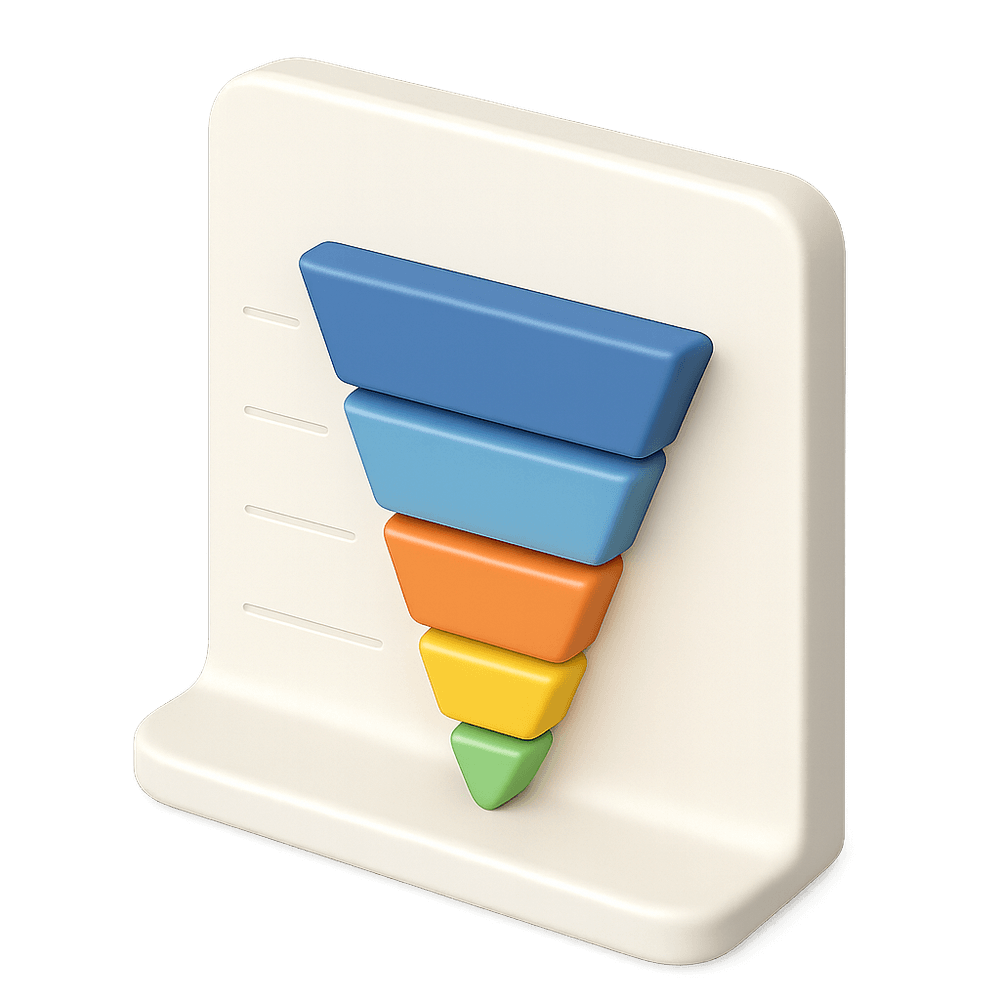
Sales Funnel Chart
A Sales Funnel Chart is a visual tool used in business and marketing to represent the stages of a sales process, showing the progression and drop-off of potential customers from initial contact to final sale. It helps organizations analyze conversion rates and optimize their sales strategies.


