Bar Chart
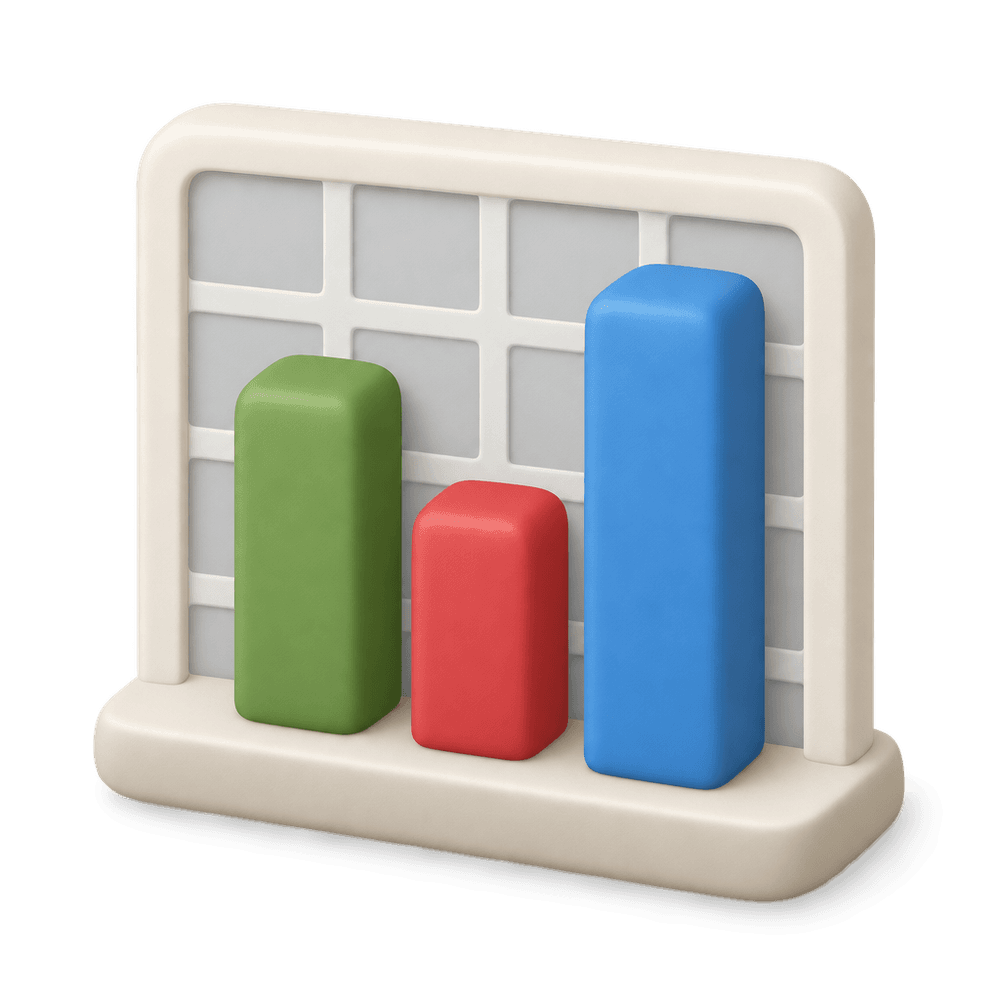
A bar chart is a graphical representation of data using rectangular bars to show the values of different categories. It is commonly used in presentations, reports, and data analysis to compare quantities visually.
A bar chart is a graphical representation of data using rectangular bars to show the values of different categories. It is commonly used in presentations, reports, and data analysis to compare quantities visually.